Visualizing my job search
This whole website started as a way for me practice writing code again, after taking a year off of working. I started working on this visualization last year while I was hunting for a job, then forgot about it after I got a job (yay!). 5 months later, here it is.
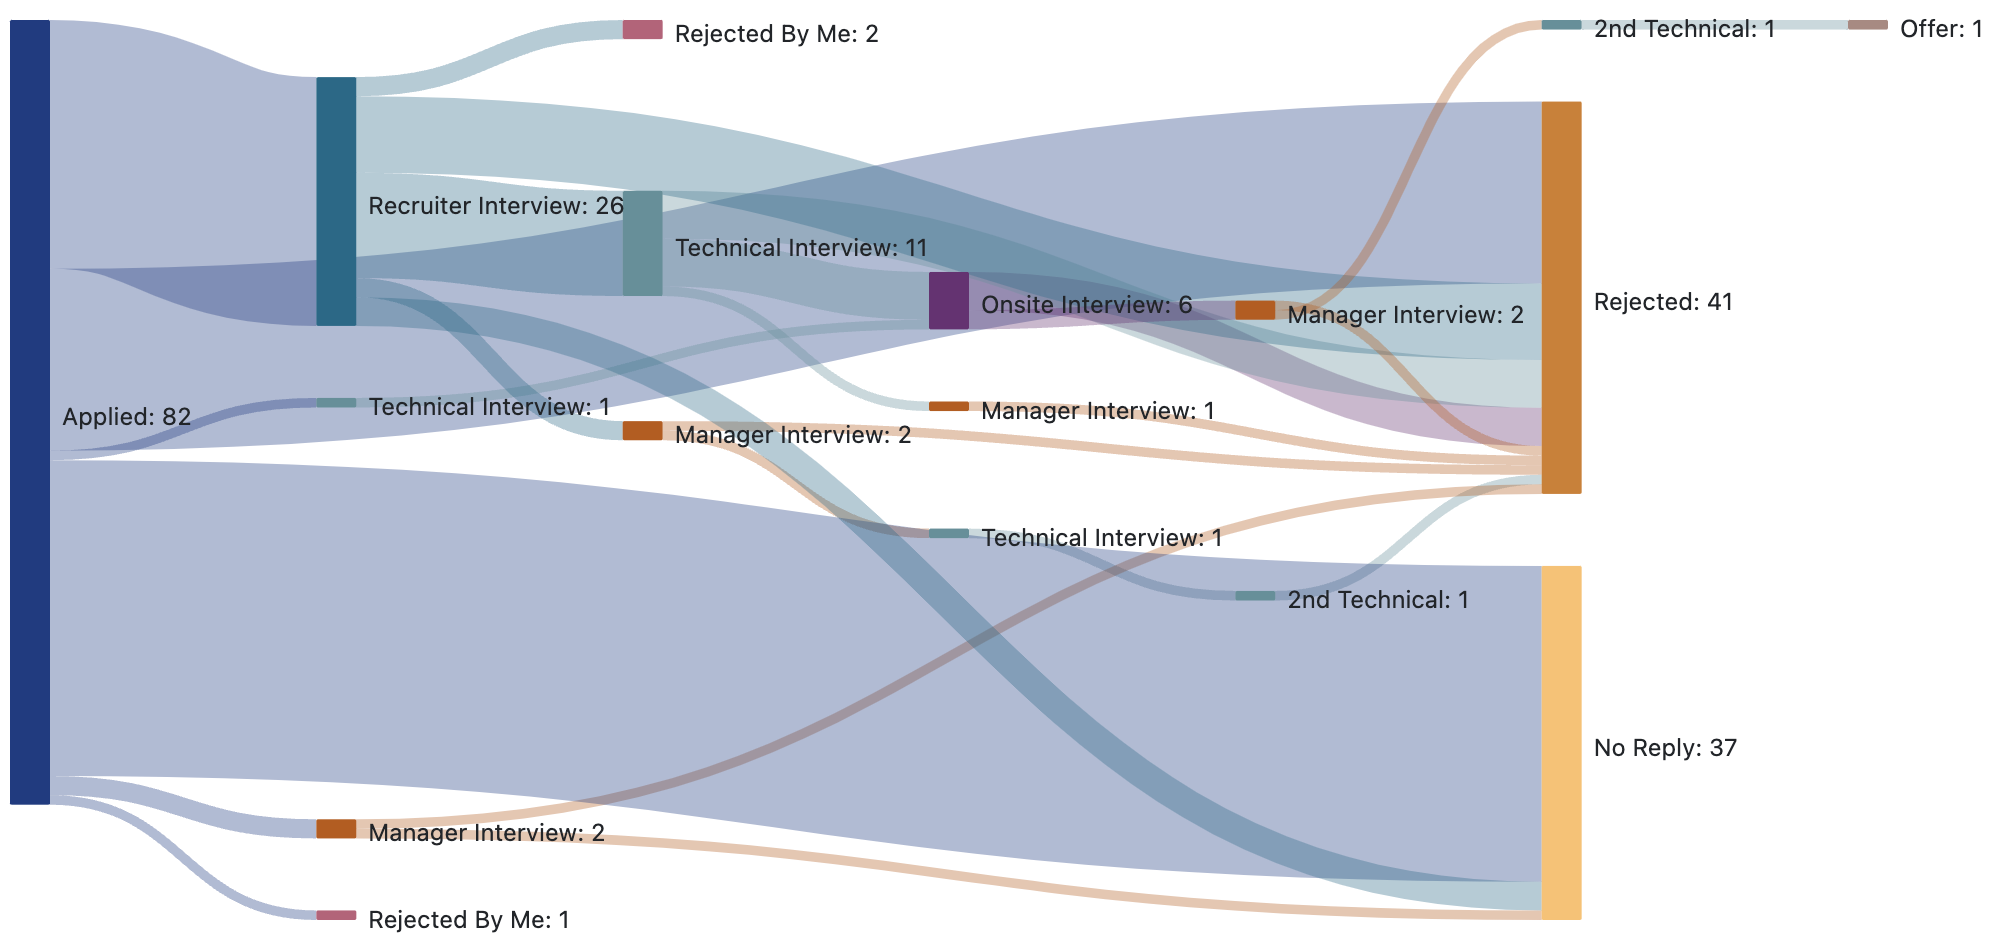
Graph of my 2023 job search
How I constructed this graph
I used d3-sankey.
Graph improvements to do
Here are some improvements I'd like to make the visualization if I have time.
- Make the diagram more responsive for mobile format.
- Add interactivity; allow hovering to reveal more details.
- Reorder the nodes to be more logical.
Some other job-hunting stats
- First application sent: February 26
- First Leetcode problem worked on: March 6
- First interview: April 20
- Last Leetcode problem worked on: July 13
- Last interview: August 7
- Accepted a job offer: August 7
- Time spent interviewing: ~4.5 months
- Leetcode problems worked on: 52